The Global Fisheries Subsidies Divide Between Small- and Large-Scale Fisheries
 Anna Schuhbauer
 Daniel J. Skerritt1
  Frédéric Le Manach
 U. Rashid Sumaila
- 1Institute for the Oceans and Fisheries, The University of British Columbia, Vancouver, BC, Canada
- 2BLOOM, Paris, France
- 3School of Public Policy and Global Affairs, The University of British Columbia, Vancouver, BC, Canada
In 2015 the Sustainable Development Goals of the United Nations stipulated that certain forms of subsidies that the fishing sector receive must be prohibited. However, the global fishing sector is complex and varied, and as such there remains a need for information on the distribution of subsidies between the different regions and their sub-sectors. This bottom-up study therefore provides up-dated and improved analyses of the financial support fishing sub-sectors receive from public entities. Estimates show that of the USD 35.4 billion of global fisheries subsidies provided in 2018, 19% went to the small-scale fishing sub-sector (SSF), including artisanal, and subsistence fisheries. Whilst more than 80% went to the large-scale (industrial) fishing sub-sector (LSF). Analysis by subsidy category and type shows, for example, that the majority of the subsidies that the LSF receive are in the form of capacity-enhancing subsidies (USD 18.3 billion) with fuel subsidies being the highest overall subsidy type (USD 7.2 billion). Fuel subsidies are especially harmful as they perpetuate fuel inefficient technology. Since the last estimate of the global fisheries subsidies divide, the percentage of capacity-enhancing subsidies within the SSF has increased from 41% in 2009 to 59% in 2018. When assessing the level of subsidization per active fisher at the global scale, a fisher involved in LSF receives disproportionally (3.5 times) more subsidies than a fisher involved in SSF and in terms of subsidies per landed value LSF receive twice as many subsidies per dollar landed than SSF. This unequal distribution of government support exacerbates the ongoing political and economic marginalization of SSF, globally. The Sustainable Development Goals and the supporting science are quite clear, we must remove all capacity-enhancing subsidies across all sub-sectors and regions which exacerbate overcapacity and overfishing, in order to ensure the sustainability of our fish stocks. Our recommendation is that capacity-enhancing subsidies be removed and instead used to support fishers through coastal fishing community projects that focus on fisheries sustainability, social justice and food security, rather than on reducing the cost of fishing or artificially enhancing profits through the provision of harmful subsidization.
Introduction
Fisheries subsidies are often defined as any direct or indirect financial transfer from public entities to the private fishing sector, which enable the enterprise, here the fishery, to make more profit than it would otherwise (e.g.,Asia-Pacific Economic Corporation [APEC], 2000; OECD, 2005; Sumaila et al., 2010). When such transfers artificially increase profits, by reducing the cost of fishing or by increasing the revenue received by fishers, they may incentivize overcapacity and therefore can lead to overfishing (Munro and Sumaila, 2002; Martini and Innes, 2018; Sumaila et al., 2019a). However, despite the fact that the global fishing sector is widely variable, to date, the majority of fisheries subsidies studies focus on the sector as a whole, without considering the different sub-sectors that subsidies effect (e.g., Milazzo, 1998, OECD, 2005, Sumaila et al., 2010).
The direct economic impact of subsidies on the fisheries and with it its potential harm and risk of overfishing must, to some extent, be relative to the economics of the fishery. Meaning, a certain subsidy to a large-scale fisheries (LSF) operation might have a different impact if it were applied to a fishery that is much smaller in scale. Yet, the impact of fisheries subsidies on small-scale fisheries (SSF, including subsistence and artisanal fisheries) in comparison to its large-scale counterpart has only recently been investigated (Jacquet and Pauly, 2008; Schuhbauer et al., 2017). Previous bottom-up assessments of the distribution of fisheries subsidies between SSF and (LSF, including industrial and semi-industrial fisheries) revealed a major imbalance in subsidy distribution, with SSF receiving about 16% of the total global fisheries subsidy amount (Schuhbauer et al., 2017). When considering the amount of people employed in each of the two sub-sectors, results based on Schuhbauer et al. (2017) show that a fisher involved in LSF benefits from about four times more subsidies than those involved in SSF, impacting the economic viability of SSF globally (Schuhbauer et al., 2017).
This imbalance is important to understand. Recent research highlights the urgency for ocean governance transformations, such as initiatives within the Blue Economy, to not only consider economic growth and environmental sustainability but to have social equity at the forefront and center (Pauly, 2018; Bennett et al., 2019; Cisneros-Montemayor et al., 2019). This means that if securing a just space for SSF in the economic development of our oceans is the goal, as Cohen et al. (2019) rightfully argue, it is critical to understand the distribution of current government support to this fishery sub-sector. Otherwise, the imbalanced drive toward generating economic growth and wealth will continue without understanding the social impact this could have on the millions of people who depend on SSF for their income (Béné et al., 2007; Cohen et al., 2019), and the food security of the poorest and most marginalized people around the world (Béné et al., 2016; Golden et al., 2017).
It is therefore of essence to pay attention to which fishing sub-sector receives certain subsidies in order to better understand the underlying impact that fisheries subsidies have, not only on the natural marine environment, but more so to the people who depend on those marine environments. With the creation of a global fisheries subsidies database for 2018 (Sumaila et al., 2019a,b), and in light of the United Nation Sustainable Development Goals and on-going negotiations within the World Trade Organization (WTO) to discipline harmful fisheries subsidies, this paper presents an up-dated estimate of the proportion of fisheries subsidies that are provided to the small- and large-scale fishing sub-sectors at the regional and global scale.
Methodology
Sumaila et al. (2019b) forms the baseline of the present study because compared to other fisheries subsidy databases, such as the OECD’s Fisheries Support Estimates (OECD, 2006), it does not only rely on each country’s official reporting but explores and analyses a much larger source of information. For example, it includes tax concessions, financial law documents and news articles. Furthermore, Sumaila et al. (2019b) reports subsidy estimates for 152 maritime countries, whereas the OECD Fisheries Support Estimates database and the WTO notifications largely only cover OECD countries and WTO members, respectively. Sumaila et al., 2019b therefore represents the most comprehensive global fisheries subsidies database publicly available.
Fisheries subsidies, as defined by Sumaila et al. (2019a), include all financial transfers, whether direct or indirect, from public entities to the fishing sector. Fisheries subsidies estimates for each individual country are subsequently divided into 13 subsidy types, which fall within three broader categories based on their impact on fish stocks over time: 1. Beneficial subsidies: Fisheries management; fisheries research and development and marine protected areas (MPAs). 2. Capacity-enhancing subsidies: Boat construction, renewal and modernization; development programs; port development; infrastructure for market and storage; fuel subsidies, non-fuel tax exemptions and fishing access agreements and 3. Ambiguous subsidies: Fisher assistance; vessel buyback and rural fisher community development. Please see attachment (Supplementary Information 1) for definitions and descriptions of each subsidy type.
Defining the Sub-Sectors
For the purpose of this paper, the global fishing sector is divided into two broad sub-sectors—the SSF, including subsistence and artisanal fisheries and the LSF, including industrial and semi-industrial fisheries. To estimate the proportion of fisheries subsidies that each receives a consistent approach to defining the two sub-sectors is required. However, currently there exists no single definition of what is regarded as SSF and LSF that is applicable across all countries. We therefore apply the definitions used by the country themselves to split their fisheries into SSF and LSF. These are then used to analyze and determine the distribution of subsidies to the two sub-sectors. Where country definitions of SSF and LSF do not exist, we applied the overarching European Union (EU) definition (European Union, 2006, 2014) for EU Member States, and for all remaining countries we used the Sea Around Us definition (Pauly and Zeller, 2016), which describe artisanal, small-scale and commercial, subsistence, and small-scale and non-commercial fisheries, which we describe here collectively as SSF: they consist of small-scale and fixed gears, they are assumed to operate only in domestic waters (i.e., in their country’s EEZ). Within their EEZ, they are further limited to a coastal area to a maximum of 50 km from the coast or to 200 m depth, whichever comes first (Pauly and Zeller, 2016).
Dividing Total Country Subsidies Between SSF and LSF
In order to determine the SSF-LSF split of each subsidy type amount for each country analyzed in this study, reported subsidies information was grouped and assessed based on three different data types; quantitative data, qualitative data, or no data reported (Figure 1). Both quantitative and qualitative data were found based on sources used in Sumaila et al. (2019b), which include: (a) federal and state budgets; (b) WTO subsidies and policy notifications; (c) the OECD’s Fisheries Support Estimates; (d) national fisheries department reports and financial summaries; (e) European Commission annual implementation reports and Operational Programs for the European Maritime Fisheries Funds (EMFF); (f) peer-reviewed and gray literature; (g) personal communication with academics and country officials; (h) national financial law documents; and (i) national tax expenditure reports.
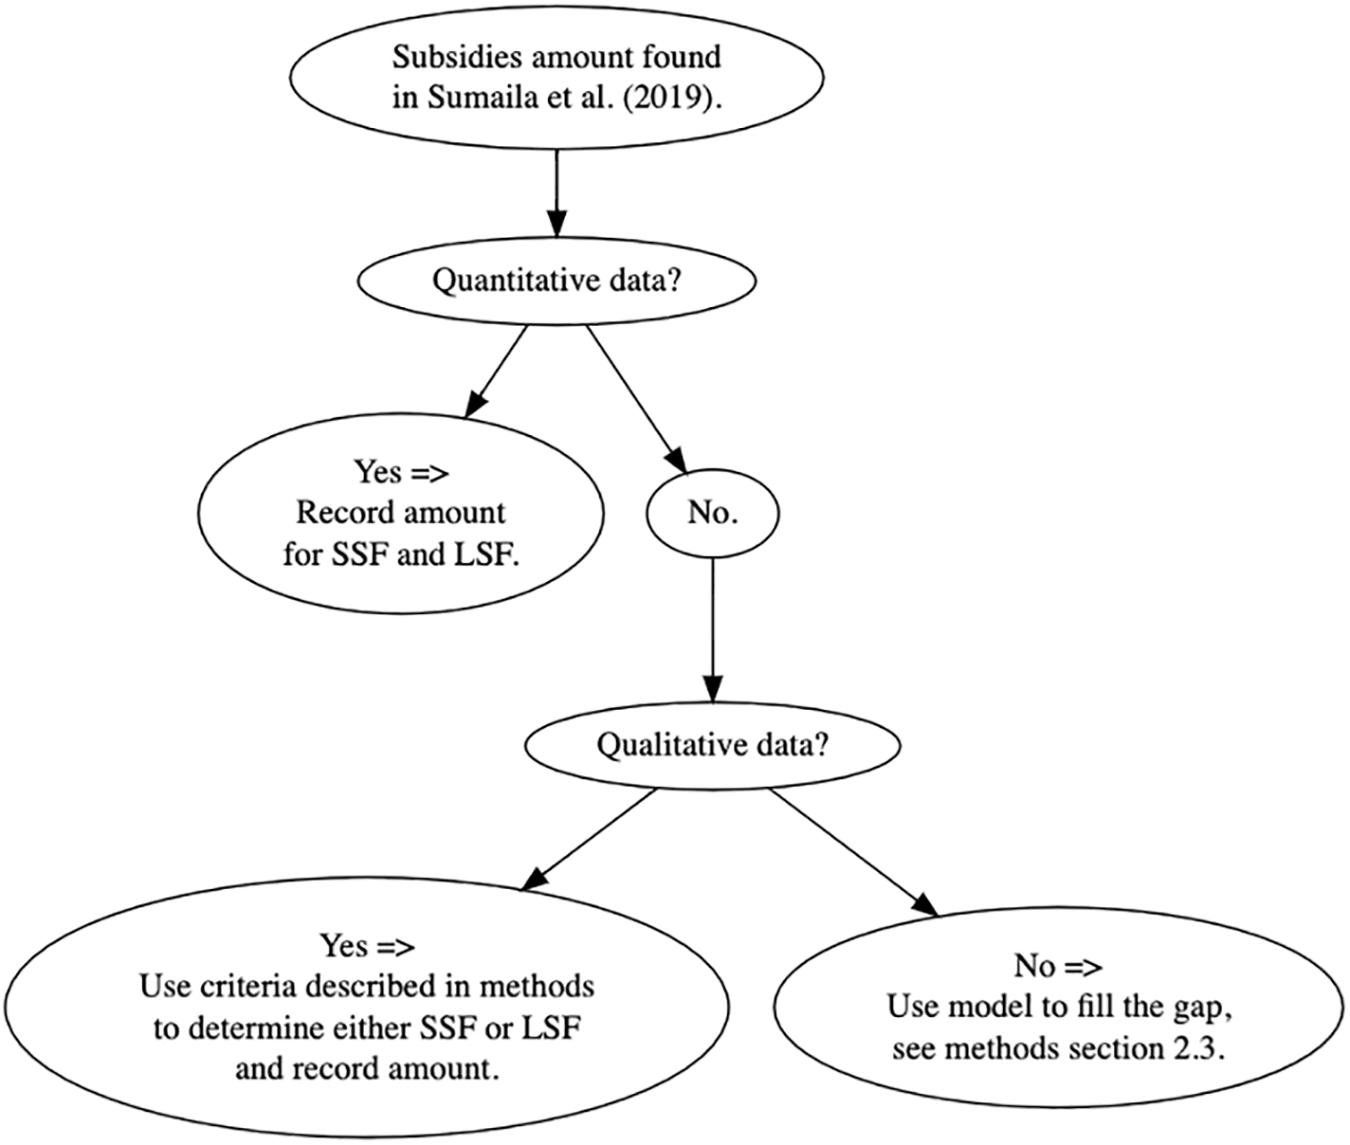
Figure 1. Methodology used to split 2018 subsidy amounts into small- (SSF) and large-scale fisheries (LSF).
Each source for each country and subsidy type was assessed independently to search for specific evidence regarding SSF and/or LSF, and if available new sources were assessed. The following questions were posed to decide under which data type each source would fall (Figure 1): 1. Is quantitative data available regarding the SSF-LSF split? If yes, dollar amount is recorded. If no, the next question follows: 2. Is qualitative information regarding the SSF-LSF split available? If yes, use the qualitative information to estimate how much of the total subsidies amount allocated to the SSF and LSF. If no, i.e., for subsidy types where neither quantitative nor qualitative data was available to allocate the subsidy amount, a model was built using geographical proximity and data from Schuhbauer et al. (2017) to fill the gaps in information (section “Filling the gaps”).
Qualitative data can be found in a variety of forms including a (usually brief) description of the objectives, regional areas or specific groups (or communities) or individual fisheries that receive the subsidy. If a subsidy amount was described by more than one objective without indicating how much was dedicated to each, the total subsidy amount was divided equally between the stated objectives. To be consistent when assessing qualitative data and descriptions of subsidies within the sources, the following key words, found in either original English documents or translated where possible and necessary, were assumed to describe SSF: artisanal, subsistence, small boats/vessels, small-scale, canoe, non-motorized or outboard motors, rural, traditional, coastal, inshore, community-based, and beach landing site. The following key words were assumed to describe the LSF: industrial, large-scale, freezer trawlers, onboard processing, sea-farer, off-shore, distant water, high sea, over sea, and deep sea (e.g., Gibson and Sumaila, 2017).
Specific assumptions were made with regard to subsidy types “rural fisher community” and “fisheries access agreements.” The former is assumed to be 100% provided to SSF because the description of the subsidy type suggests that only SSF benefit, based on the present definition of SSF. The latter is assumed to be 100% provided to LSF because based on our SSF definition, no SSF operates in the EEZs of another country.1 No up-dated information was found on the subsidy type “MPA,” and therefore all MPA subsidies were divided between SSF and LSF based on data from (Schuhbauer et al., 2017).
In total the present study analyzed data from 61 countries, selected based on information availability and their overall contribution to global fisheries subsidies, meaning the highest subsidizing countries were prioritized. Together, the 61 assessed countries represent 92% of the total global fisheries subsidies amount based on (Sumaila et al., 2019b).
Filling the Gaps
To fill the gaps regarding the divide between SSF and LSF subsidies for the remaining countries, we first divided the 61 maritime countries into 21 sub-regions (based on the UN geoscheme2). We then calculated the mean proportion of subsidies provided to SSF for each subsidy type and for each sub-region based on all reported and assessed data in this study (Eq. 1).
Where, propSSF is the proportion of SSF subsidies to total subsidies, s = 1 to S denotes sub-region; j = 1 to J is the subsidy subtype and i = 1 to I denotes country.
We calculate the 2009 proportion of SSF subsidies of each country i and type j for the sub-region s in which country i is located using data from Schuhbauer et al. (2017). This information (Eq. 2) is used as an adjustment factor to estimate the SSF subsidies for all countries and subsidy types, which have not been assessed.
The adjustment factor is then multiplied with the up-dated SSF subsidy per sub-region s and subsidy type j (Eq. 3).
The final proportion of SSF subsidy estimates for each country and subsidy type (propSSFestimatei,j) from Eq. 3 is then multiplied with the total amount of subsidy per type for each country in 2018 taken from Sumaila et al. (2019b) to present the absolute SSF subsidy amount in USD for the year 2018. Completed code for the model and all raw data (input) as well as the resulting output file presenting the split of subsidies into LSF and SSF are publicly available on a Github repository: https://github.com/annaschu/small-scale-fisheries-subsidies-2020.
Categories and Further Analysis
To better understand the divide into SSF and LSF not only at a subsidy category, subtype and regional level we also analyzed our data by political groups: (a) United Nation based developed versus developing countries and (b) low and high Human Development Index (HDI) groups. While the UN developed and developing grouping is commonly used when working with global data, original subsidies data (Sumaila et al., 2019b) was grouped using the 2017 United Nation HDI for part of the analysis and presentation of the results (Sumaila et al., 2019a). This was based on the United Nations Development Programme’s (UNDP) cut-off where all countries below 0.7 HDI are part of the low HDI group and all countries equal or above 0.7 part of a high HDI group. As our dataset for splitting global subsidies into LSF and SSF is based on Sumaila et al. (2019b), we use the same grouping, presenting global subsidies based on subsidy categories and split into High and Low HDI groups.
Additionally, to better understand what the percentage of subsidies provided to each sub-sector means in terms socio-economics, we calculated the subsidy intensity by dividing the amount of subsidies by the number of fishers active in each sub-sector and the amount of subsidies per dollar of landed value for each sector. Employment data are taken from Teh and Sumaila (2013), who provide the most complete estimate of marine fisheries employment, globally and landed value data are based on UBC FERU and Sea Around Us database.3 Data are presented at global scale as well as divided into political groups.
Results
Of the reported global fisheries subsidies total of USD 35.4 billion in 2018 (Sumaila et al., 2019a), our results show that 19% were provided to SSF, some USD 6.6 billion (Figure 2 and Supplementary Information 2 for all subsidy data by country). Estimates by subsidy category show that the majority (59%) of the total USD 6.6 billion go to SSF as capacity-enhancing subsidies, 31% as beneficial and the remaining 10% as ambiguous subsidies (Figure 2). A similar divide can be observed in the LSF sub-sector, where a slightly higher amount is provided as capacity-enhancing subsidies (64%). It is important to note that the amount going to LSF as capacity-enhancing subsidies (USD 18.3 billion), account for almost 52% of all fisheries subsidies.
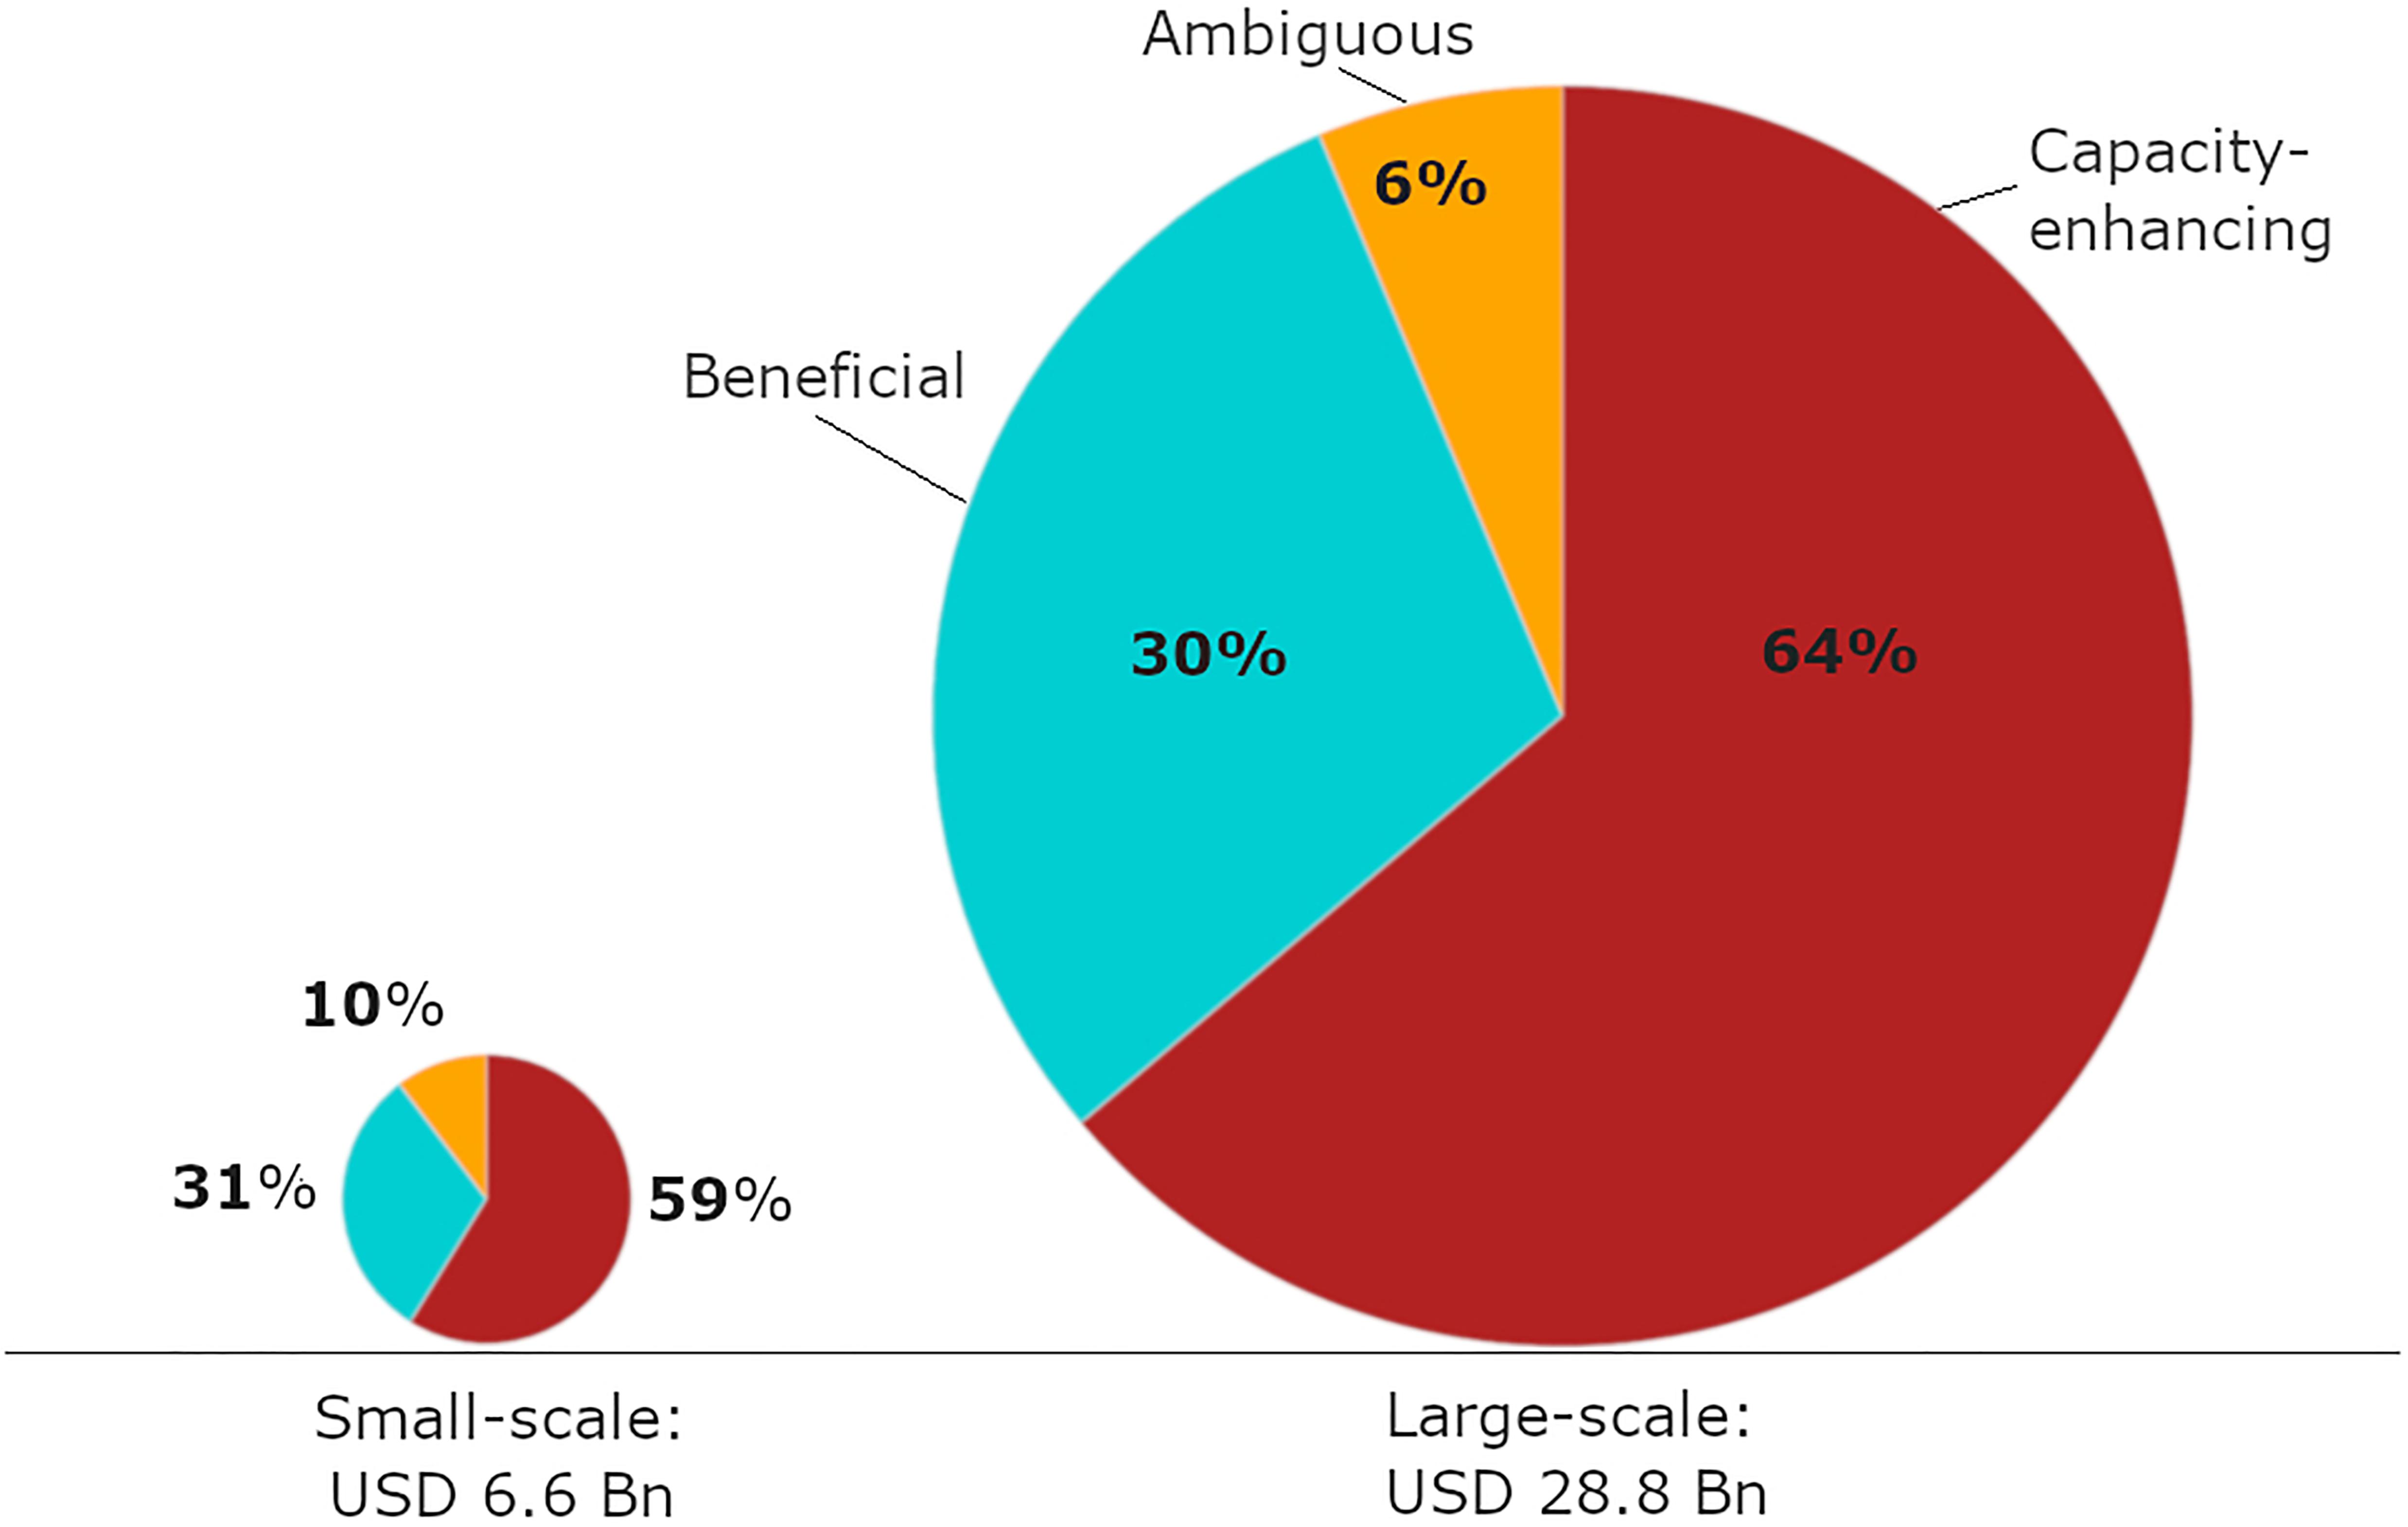
Figure 2. Global fisheries subsidy amounts by category and grouped by SSF and LSF for 2018 (constant 2018 USD).
Figure 3 presents subsidy amounts split into SSF and LSF by subsidy subtype. “Fuel subsidies” is the largest subsidy type provided to the fishing sector globally, with about 7% of this goes to the SSF (Figure 3). The next highest capacity-enhancing subsidy types, “tax exemption,” “fisheries development projects,” and “market and storage infrastructure,” SSF receive 16, 30, and 32%, respectively (Figure 3). Of the beneficial subsidies, the SSF receive 19, 24, and 13% for “fisheries management,” “MPAs,” and “research and development,” respectively.
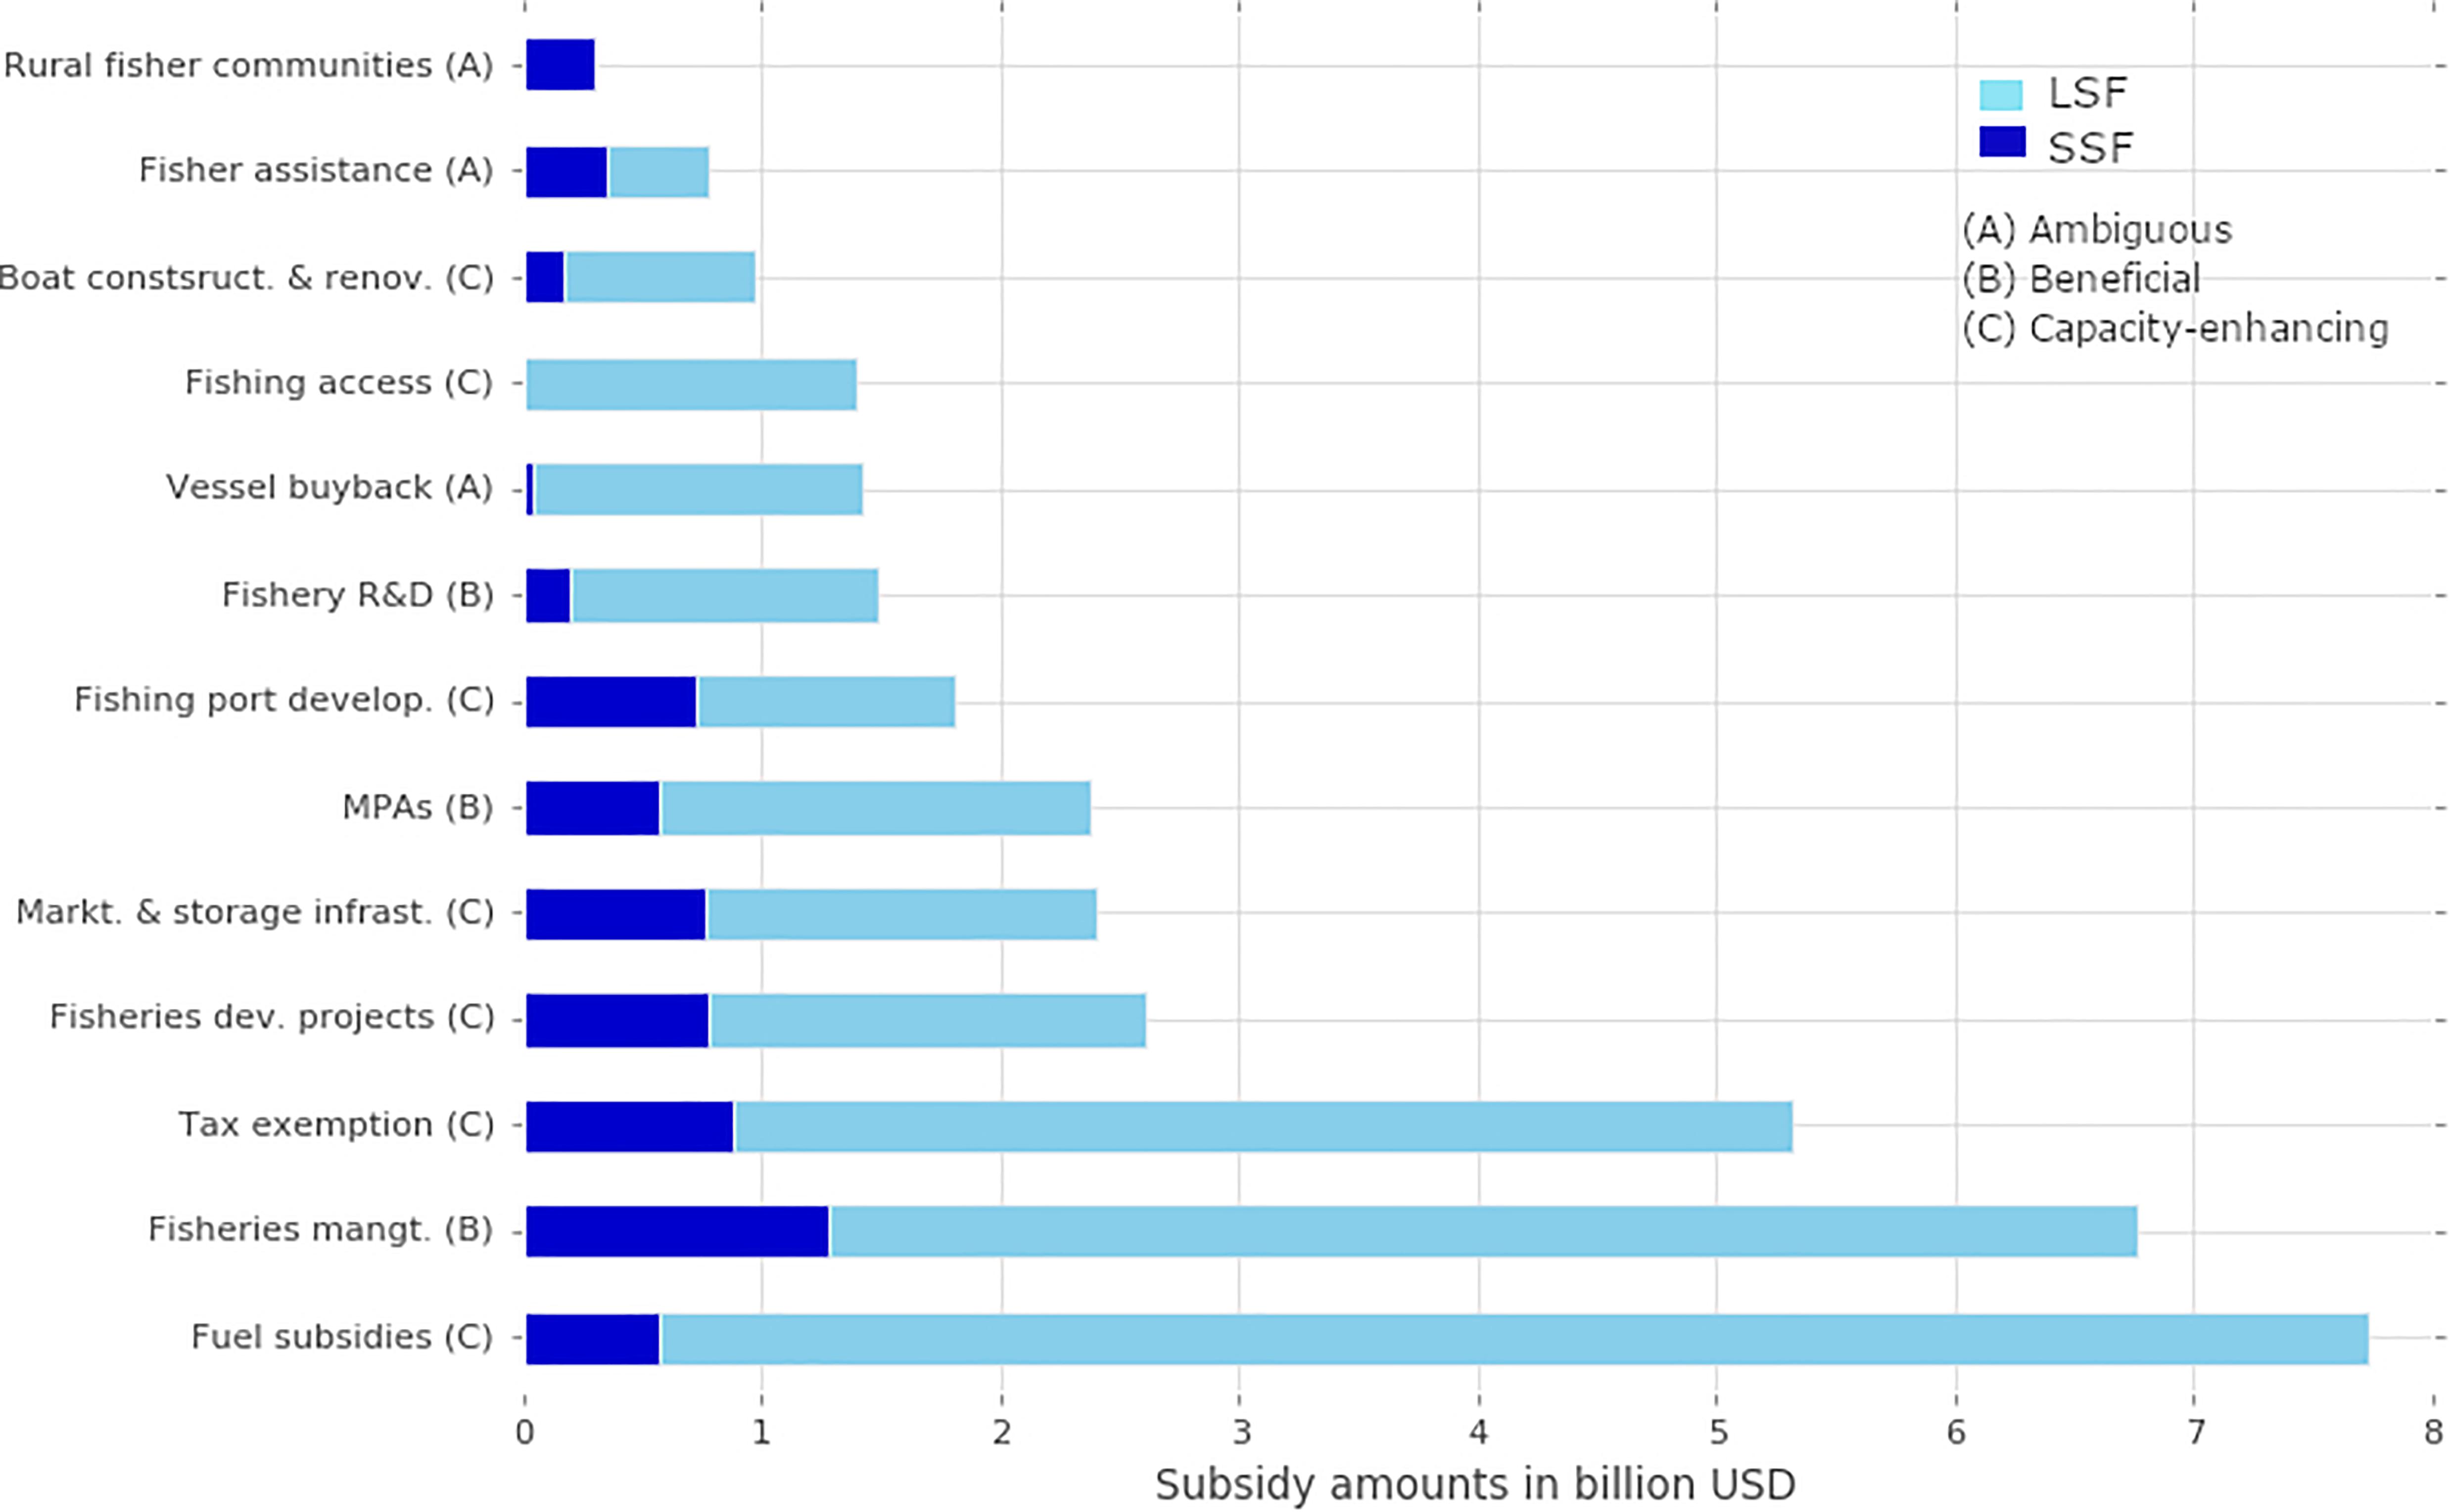
Figure 3. Composition of 2018 fisheries subsidies amounts by type and grouped by SSF and LSF for 2018 (constant 2018 USD).
Subsidy estimates for SSF by region show that the largest proportion of subsidies provided to the SSF is within Africa, at 34% of about USD 2 billion in total (both SSF and LSF combined; Figure 4). The largest region in terms of overall subsidies, Asia (excluding China), provides about 25% (USD 3 billion) to SSF and China itself only 4% (USD 0.3 billion) to SSF (Figure 4). While China was not analyzed separately in the model, it is presented separately from the rest of Asia in the results section as it is such a large subsidizing entity, providing about 21% of the global total, making it difficult to compare the regions if combined with the rest of Asia.
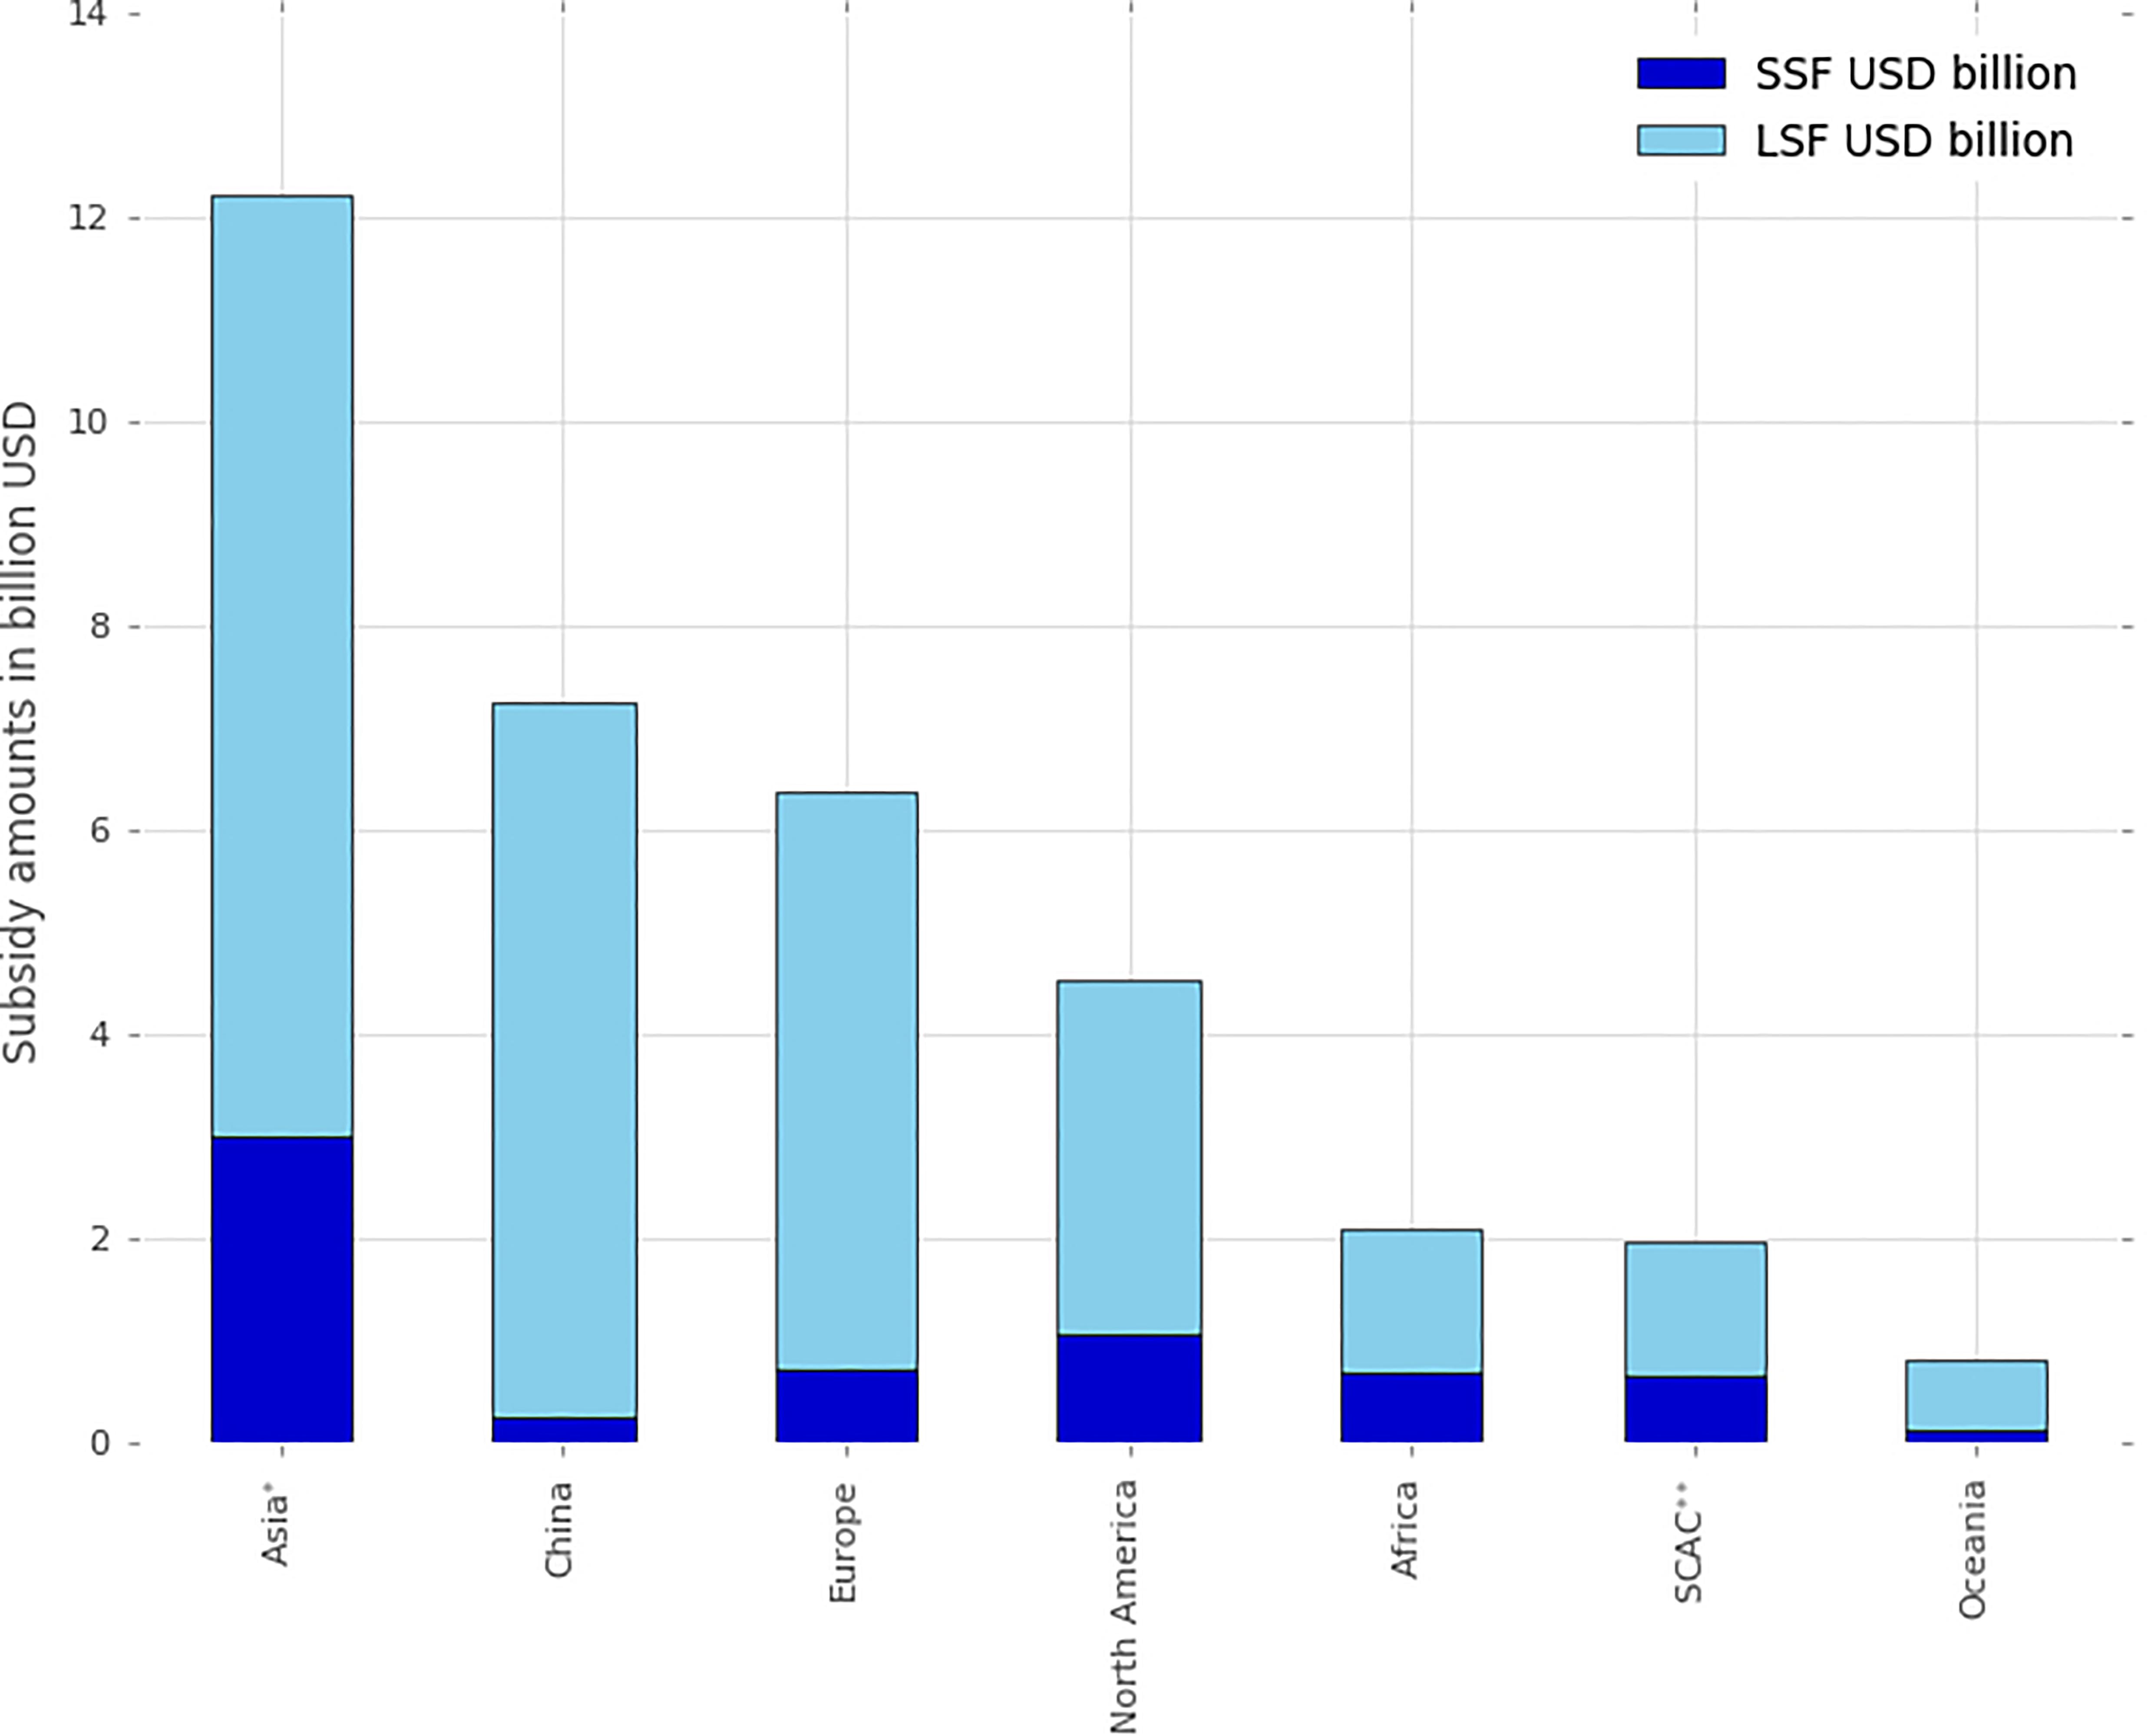
Figure 4. Subsidy amounts by major region broken down into SSF and LSF for 2018 (constant USD), showing China separately. *Rest of Asia excluding China, **South, Central America and Caribbean.
Results grouped by developed and developing countries (based on official UN classification) indicate that LSF of developing countries are the largest subsidized group with USD 19 billion (Figure 5A). In this categorization, large fishing nations such as China and Russia are part of developing countries. Broken down into subsidy categories, LSF in developing countries receive USD 13.6 billion as capacity-enhancing subsidies (Figure 5A). The lowest amount is around USD 0.2 billion, which is ambiguous subsidies for SSF in developed countries (Figure 5A). Developing countries provide more subsidies in absolute amounts to their SSF than the developed countries do to their SSF (Figure 5A).
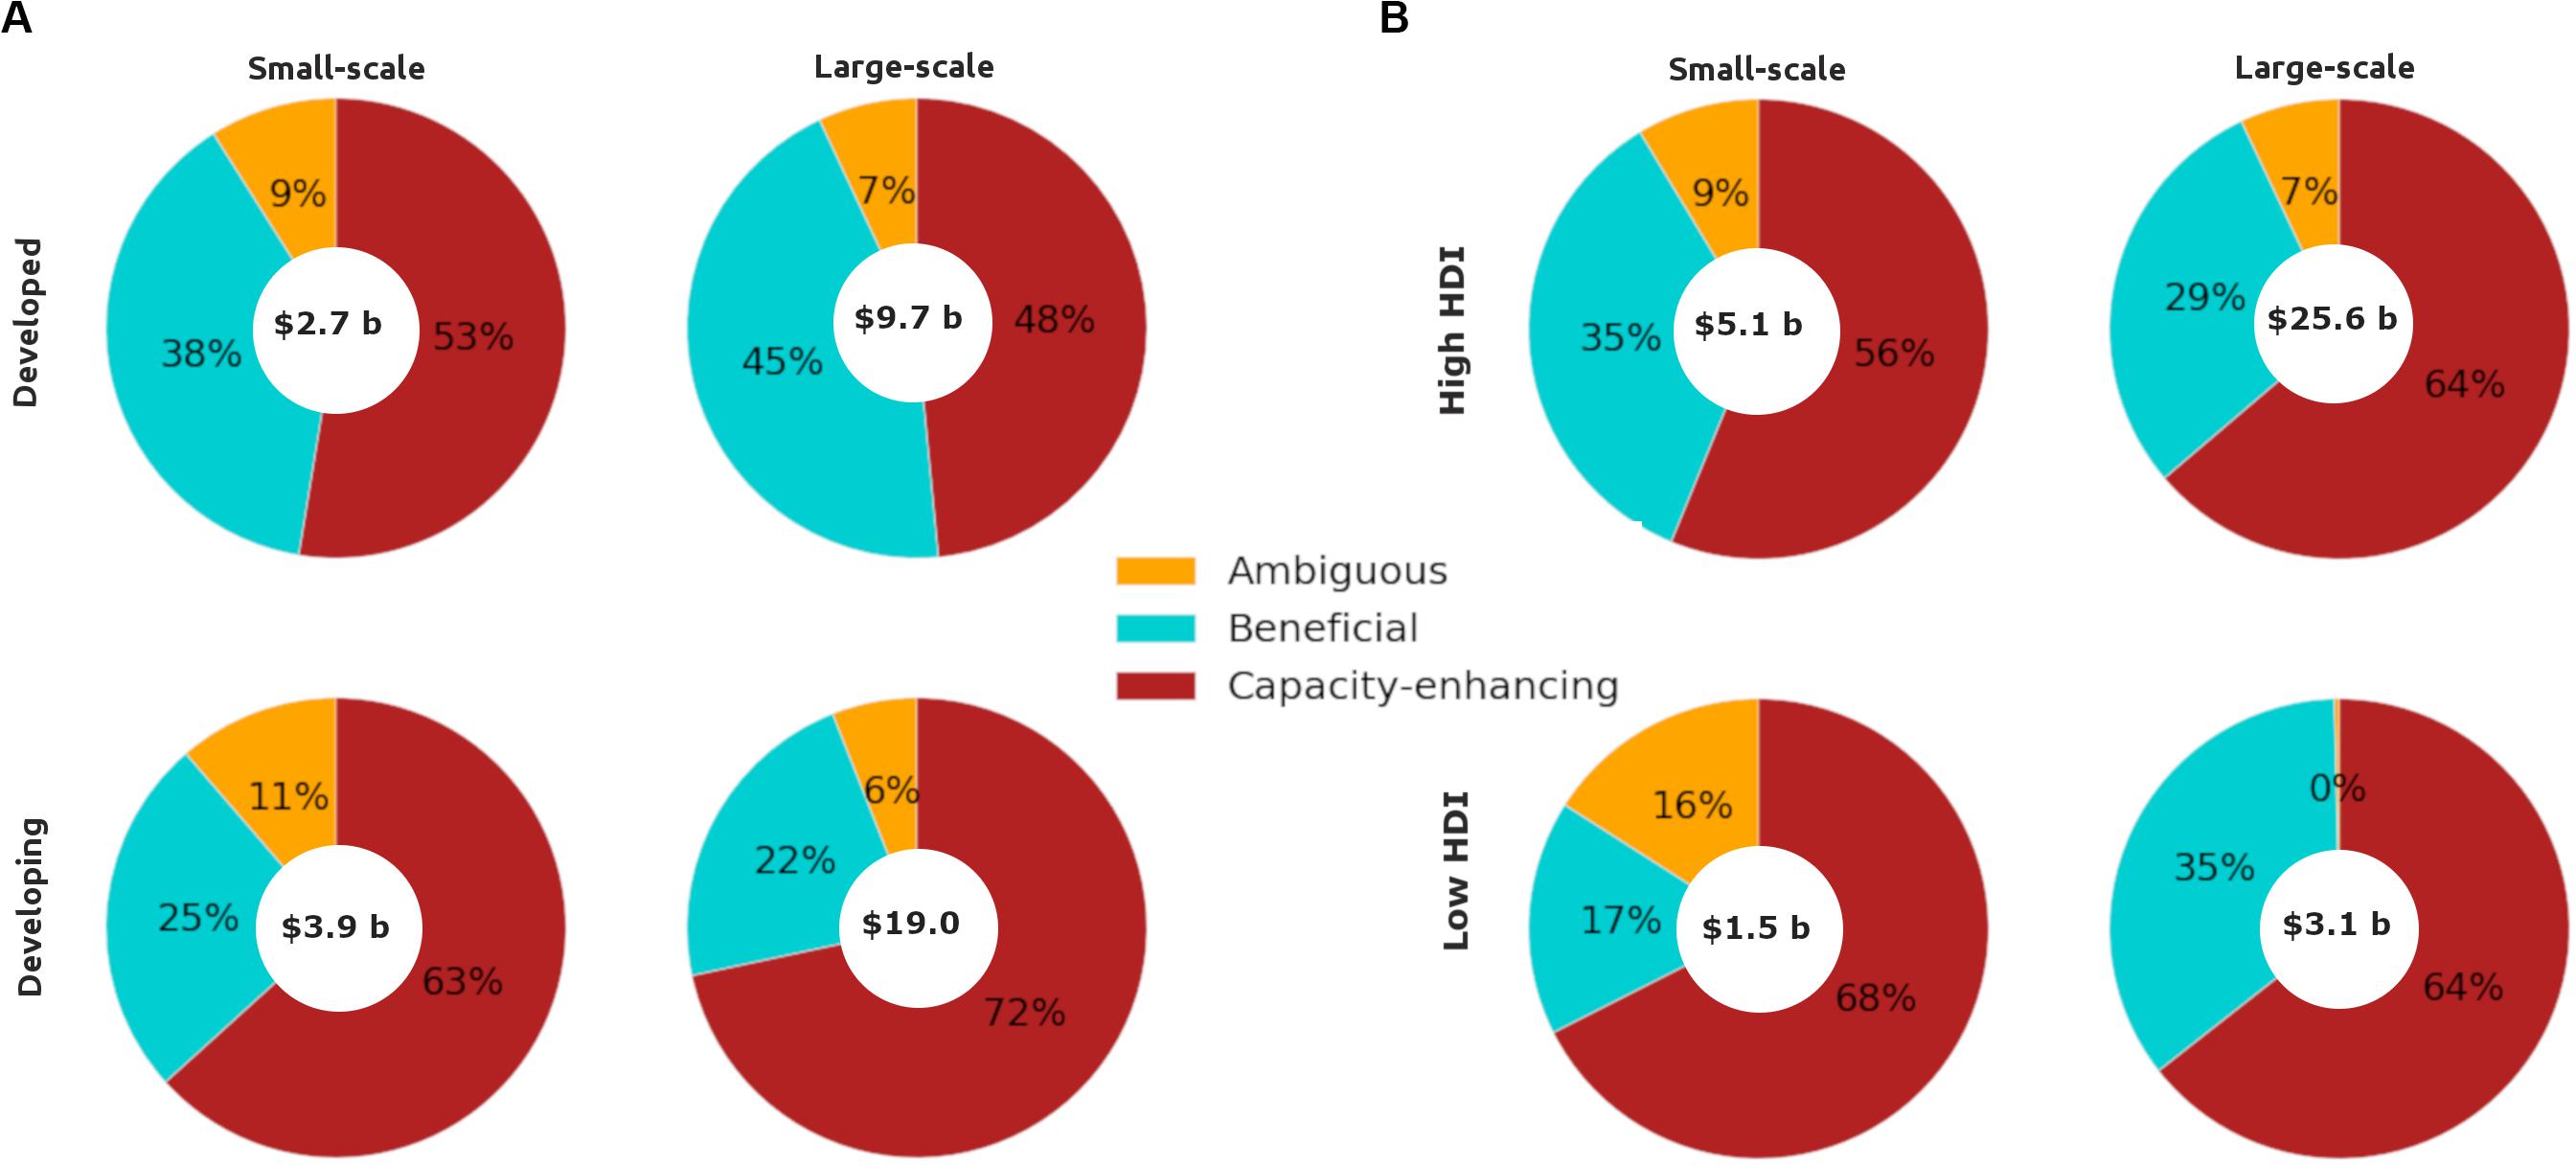
Figure 5. Global fisheries subsidies (2018 constant USD) presented for small- and large-scale fisheries by subsidy category and grouped by (A) developed and developing countries and (B) High and Low HDI groups.
Figure 5B, in which large fishing nations such as China and Russia grouped with High HDI countries, shows that LSF of countries with a high HDI are by far the largest subsidizing group, representing almost 73% of global subsidies (USD 25.6 billion; Figure 5B). Capacity-enhancing subsidies make up for majority of subsidies in all four groups. However, with regard to ambiguous subsidies there is a large difference between SSF (16%) and LSF (0.4%) in the Low HDI group.
To understand what this difference in subsidization could mean in real terms to the fishers in each sub-sector, we computed subsidy per number of fishers. This helps us understand how the amounts of subsidies are distributed based how many people are impacted by fisheries subsidies in SSF and LSF. Here, we present results based on High and Low HDI groups as well as developed and developing groups. Trends and ratios between SSF and LSF are similar when comparing the different political groups (Tables 1a,b) and clearly show the discrepancy in subsidy intensity between SSF and LSF to be much larger in Developed and High HDI countries (5.9 and 5.2, respectively) than in Developing and Low HDI countries (3.4 and 1.2, respectively). Globally, this shows that a LSF fisher would benefit from about 3.5 times more subsidies than a SSF fisher.
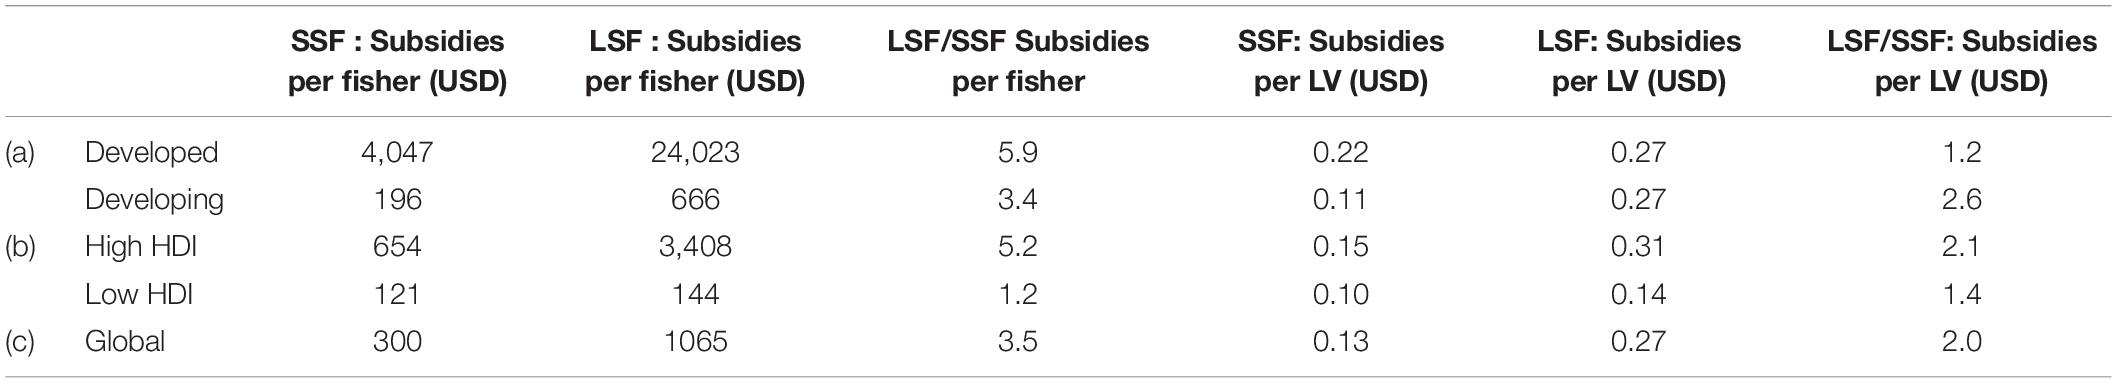
Table 1. Global fisheries subsidies (2018 constant USD) and subsidy intensity (SI; subsidy amount per number of fishers and per total landed value) per (a) Developed and Developing nations, (b) High and Low HDI countries and (c) globally, split into small- (SSF) and large-scale fisheries (LSF).
With regard to the subsidy intensity, when analyzing the amount of subsidies provided in relation to the total landed value per fishing sector, results show a similar overall trend. Globally LSF receive twice as many subsidies per dollar of landed value than SSF (Table 1c). It is worth noting that Developing countries have a higher discrepancy of subsidization compared to Developed countries (Table 1a) whereas the Low HDI countries have a smaller difference between LSF and SSF compared to the High HDI countries (Table 1b).
Discussion
Results of this study clearly show that there is an imbalance toward the LSF sub-sector, who receive the vast majority of fisheries subsidies. While the current analysis is based on an up-dated dataset for 2018, the results are similar to those produced using a subsidies dataset for 2009, where results showed a total of 16% being provided to the SSF (Schuhbauer et al., 2017) compared to the 19% estimated in the present study.
As capacity-enhancing subsidies undermine sustainable fishing practices and can promote overfishing, we already know that it is of concern that these subsidies as a percentage of the global total, have increased from 57% in 2009 to 63% 2018 (Sumaila et al., 2019a). Looking into capacity-enhancing subsidies in terms of SSF, the proportion received by the SSF has increased from 41% in 2009 to 59% in 2018. Whereas the percentage of capacity-enhancing subsidies received by the LSF has increased from 61% in 2009 to 64% in 2018. These comparisons indicate that the increase in SSF capacity-enhancing subsidies play a major role in the increase of global capacity-enhancing subsidies reported in Sumaila et al. (2019a). As such the percentage of beneficial subsidies received by SSF has decreased from 48% in 2009 to 31% in 2018. While the proportion of ambiguous subsidies provided to the SSF has changed little, it being 11% in 2009 and 10 % in 2018.
Additionally, it is important to think about how capacity-enhancing subsidies support illegal and unreported fishing behaviors. We already know that globally the majority of unreported and illegal catch is carried out by LSF leading to illicit trade which results in billions of dollars lost to our societies (Sumaila et al., 2020). Fuel subsidies make up the largest proportion of capacity-enhancing subsidies provided. They are known for their negative impacts on the marine environment and the fisheries economy and perpetuate the use of fuel-inefficient technologies (Sumaila et al., 2008; Harper et al., 2012). Fuel subsidies to LSF make up around 20% of total global fisheries subsidies (USD 7.2 billion), while USD 0.6 billion is provided to the SSF sub-sector, this amount not changing since 2009. These subsidies essentially help LSF stay in business even when operating costs outweigh total revenue gained from fishing and therefore making LSF artificially more competitive over the already mostly disadvantaged and politically marginalized SSF sub-sector (Pauly, 1997; Chuenpagdee, 2011).
When analyzing the subsidies grouped by political entities results show that the SSF of the low HDI countries, which represent the poorest fishing communities, receive the smallest share of beneficial subsidies of all. This gives reason to assume that these countries lack support for management, monitoring and research.
Caveats of the Analysis
The main challenge, which has been reported in previous studies on fisheries subsidies (e.g., Charles, 2011; Schuhbauer et al., 2017; Sumaila et al., 2019a), was the scarcity of information and lack of transparency. Additionally, when information was found, it often did not include much detail on the aim of the subsidy, making it difficult to assess how much was provided to SSF or LSF. Therefore, the gap filling process became challenging as not many data points per geographic subregion and subsidy type were available to calculate averages. Regions with low data availability were Middle Africa, Western Asia, Micronesia, and Polynesia, which makes their final output more dependent on the data modeled in Schuhbauer et al. (2017) compared to the other regions.
Conclusion and Policy Recommendations
Based on our analysis and what it means in terms of global fisheries policy, we make the following recommendations:
– In order to bring the exploitation of our global fisheries in line with their production (e.g., IPBES, 2019), capacity-enhancing subsidies need to be eliminated. Otherwise, the depletion of coastal resources that these fishers’ livelihoods depend on will continue and their future viability will continue to be threatened.
– While it is understandable that subsidies toward SSF are increased to support their short-term needs, we argue that capacity-enhancing subsidies need to be reduced to zero for all fishery sub-sectors as they (a) do not reach the poor SSF fishers in developing or low HDI and developing countries compared to their large-scale counterparts; and (b) are known to deplete fish stocks, which leads to increased poverty over time in communities who depend on fish for a living;
– Funds currently used for capacity-enhancing subsidies for both sub-sectors should be redirected with long term goals in mind to work on projects for coastal communities that help them achieve social equity, economic viability and resilience;
– Transparency in fisheries subsidy reporting needs to be increased. Having information on the specific types of subsidies provided at the country level is essential, however, we also need to know how these funds are distributed and how each sub-sector is impacted. This could be achieved by ensuring that WTO notifications, for example, require the member country to disclose how subsidies are disseminated.
– To achieve a socially just governance transformations toward sustainable fisheries, we need to understand what role government subsidies play otherwise the drive toward economic growth and wealth creation from fishery resources would override the social need of fishers and their communities, with dire consequences for them and us all.
Data Availability Statement
All datasets generated for this study are included in the article/Supplementary Material.
Author Contributions
AS and US developed the presented idea and the computational model. NE, DS, FLM, and AS collected the data. AS performed all the calculations and analyzed the data. DS co-wrote the manuscript with AS. All authors discussed the results and contributed to the final manuscript.
Funding
We thank the Pew Charitable Trusts for financial support which made this work possible.
Conflict of Interest
The authors declare that the research was conducted in the absence of any commercial or financial relationships that could be construed as a potential conflict of interest.
Acknowledgments
We thank Dr. Elena Finkbeiner and Dr. Sebastian Villasante for their thoughtful reviews as well as to the peer reviewers for their time and insightful comments.
Supplementary Material
The Supplementary Material for this article can be found online at: https://www.frontiersin.org/articles/10.3389/fmars.2020.539214/full#supplementary-material
Footnotes
- ^ Except in the special case of few countries, e.g., Tanzania, where SSF vessels fish within their neighboring EEZ, but no evidence of official access agreements or fees paid could be found and in the case of European Union Member States, but no fisheries access payment is required due to the shared nature of EU EEZs.
- ^ United Nations Standard country or area codes for statistical use (M49) geoscheme: http://unstats.un.org/unsd/methods/m49/m49regin.htm last accessed September 2019.
- ^ www.seaaroundus.org (last accessed May 2020).
References
Asia-Pacific Economic Corporation [APEC] (2000). Study into the Nature and Extent of Subsidies in the Fisheries Sector of APEC Member Economies, APEC Committee on Trade and Investment. Singapore: PricewaterhouseCoopers and Asia Pacific Economic Cooperation Secreteriat.
Béné, C., Arthur, R., Norbury, H., Allison, E. H., Beveridge, M., Bush, S., et al. (2016). Contribution of fisheries and aquaculture to food security and poverty reduction: assessing the current evidence. World Dev. 79, 177–196. doi: 10.1016/j.worlddev.2015.11.007
Béné, C., Macfadyen, G., and Allison, E. H. (2007). Increasing the Contribution of Small-Scale Fisheries to Poverty Alleviation and Food Security. Rome: FAO.
Bennett, N. J., Cisneros-Montemayor, A. M., Blythe, J., Silver, J. J., Singh, G., Andrews, N., et al. (2019). Towards a sustainable and equitable blue economy. Nat. Sustain. 2, 991–993. doi: 10.1038/s41893-019-0404-1
Charles, A. (2011). Small-scale fisheries: on rights, trade and subsidies. Maritime Stud. 10, 85–94.
Chuenpagdee, R. (2011). World Small-Scale Fisheries: Contemporary Visions. Utrecht: Eburon Uitgeverij.
Cisneros-Montemayor, A. M., Moreno-Báez, M., Voyer, M., Allison, E. H., Cheung, W. W. L., Hessing-Lewis, M., et al. (2019). Social equity and benefits as the nexus of a transformative blue economy: a sectoral review of implications. Mar. Policy 109:103702. doi: 10.1016/j.marpol.2019.103702
Cohen, P. J., Allison, E. H., Andrew, N. L., Cinner, J., Evans, L. S., Fabinyi, M., et al. (2019). Securing a just space for small-scale fisheries in the blue economy. Front. Mar. Sci. 6:171. doi: 10.3389/fmars.2019.00171
European Union (2006). Council Regulation (EC) No 1198/2206 of 27 July 2006 on the European Fisheries Fund. Official Journal L 223, 1–44.
European Union (2014). Regulation (EU) No 508/2014 of the European Parliament andof the Council of 15 May 2014 on the European Maritime and Fisheries Fund and repealing Council Regulations (EC) No 2328/2003, (EC) No 861/2006, (EC)No1198/2006 and (EC) No 791/2007 and Regulation (EU) No 1255/2011 of the EuropeanParliament and of the Council. Official Journal L 149, 1–66.
Gibson, D., and Sumaila, U. R. (2017). Determining the degree of “small-scaleness” using fisheries in British Columbia as an example. Mar. Policy 86, 121–126. doi: 10.1016/j.marpol.2017.09.015
Golden, J. S., Virdin, J., Nowacek, D., Halpin, P., Bennear, L., and Patil, P. G. (2017). Making sure the blue economy is green. Nat. Ecol. Evol. 1, 1–3. doi: 10.1038/s41559-016-0017
Harper, S., Bevacqua, D., Chudnow, R., Giorgi, S., Guillonneau, V., Le Manach, F., et al. (2012). Fuelling the fisheries subsidy debate: agreements, loopholes and implications. Fish. Res. 113, 143–146. doi: 10.1016/j.fishres.2011.10.007
IPBES (2019). Global Assessment Report on Biodiversity and Ecosystem Services. Available at: https://ipbes.net/global-assessment (accessed February 27, 2020).
Jacquet, J., and Pauly, D. (2008). Funding priorities: big barriers to small-scale fisheries. Conserv. Biol. 22, 832–835. doi: 10.1111/j.1523-1739.2008.00978.x
Milazzo, M. (1998). Subsidies in World Fisheries a Reexamination. Washington, DC: World Bank. doi: 10.1596/0-8213-4216-9
Munro, G., and Sumaila, U. R. (2002). The impact of subsidies upon fisheries management and sustainability: the case of the North Atlantic. Fish Fisher. 3, 233–250. doi: 10.1046/j.1467-2979.2002.00081.x
OECD (2005). Subsidies: A Way Towards Sustainable Fisheries?. Paris: Organization for Economic Cooperation and Development.
OECD (2006). Financial Support to Fisheries: Implications for Sustainable Development. Paris: Organization for Economic Co-operation and Development. doi: 10.1787/9789264036642-en
Pauly, D. (1997). “Small-scale fisheries in the tropics: marginality, marginalization, and some implications for fisheries management,” in Proceedings of the Global Trends, Fisheries Management, American Fisheries Society Symposium 20, Bethesda, MD.
Pauly, D. (2018). A vision for marine fisheries in a global blue economy. Mar. Policy 87, 371–374. doi: 10.1016/j.marpol.2017.11.010
Pauly, D., and Zeller, D. (2016). “Marine fisheries catch reconstruction: definitions, sources, methodology and challenges,” in Global Atlas of Marine Fisheries: Ecosystem Impacts and Analysis, eds D. Pauly and D. Zeller (Washington, DC: Island Press), 171–181.
Schuhbauer, A., Chuenpagdee, R., Cheung, W. W. L., Greer, K., and Sumaila, U. R. (2017). How subsidies affect the economic viability of small-scale fisheries. Mar. Policy 82, 114–121. doi: 10.1016/j.marpol.2017.05.013
Sumaila, U. R., Ebrahim, N., Schuhbauer, A., Skerritt, D., Li, Y., Kim, H. S., et al. (2019a). Updated estimates and analysis of global fisheries subsidies. Mar. Policy 109:103695. doi: 10.1016/j.marpol.2019.103695
Sumaila, U. R., Skerritt, D., Schuhbauer, A., Ebrahim, N., Li, Y., Kim, H. S., et al. (2019b). A global dataset on subsidies to the fisheries sector. Data Brief 27:104706. doi: 10.1016/j.dib.2019.104706
Sumaila, U. R., Khan, A. S., Dyck, A. J., Watson, R., Munro, G., Tydemers, P., et al. (2010). A bottom-up re-estimation of global fisheries subsidies. J. Bioecon. 12, 201–225. doi: 10.1007/s10818-010-9091-8
Sumaila, U. R., Teh, L., Watson, R., Tyedmers, P., and Pauly, D. (2008). Fuel price increase, subsidies, overcapacity, and resource sustainability. ICES J. Mar. Sci. 65, 832–840. doi: 10.1093/icesjms/fsn070
Sumaila, U. R., Zeller, D., Hood, L., Palomares, M. L. D., Li, Y., and Pauly, D. (2020). Illicit trade in marine fish catch and its effects on ecosystems and people worldwide. Sci. Adv. 6:eaaz3801. doi: 10.1126/sciadv.aaz3801
Keywords: fisheries subsidies, small-scale fisheries, Sustainable Development Goals, social inequity, fisheries sustainability
Citation: Schuhbauer A, Skerritt DJ, Ebrahim N, Le Manach F and Sumaila UR (2020) The Global Fisheries Subsidies Divide Between Small- and Large-Scale Fisheries. Front. Mar. Sci. 7:539214. doi: 10.3389/fmars.2020.539214
Received: 29 February 2020; Accepted: 31 August 2020;
Published: 29 September 2020.
Edited by:
Tomaso Fortibuoni, Higher Institute for Environmental Protection and Research (ISPRA), ItalyReviewed by:
Dimitrios K. Moutopoulos, University of Patras, GreecePablo Pita, University of Santiago de Compostela, Spain
Copyright © 2020 Schuhbauer, Skerritt, Ebrahim, Le Manach and Sumaila. This is an open-access article distributed under the terms of the Creative Commons Attribution License (CC BY). The use, distribution or reproduction in other forums is permitted, provided the original author(s) and the copyright owner(s) are credited and that the original publication in this journal is cited, in accordance with accepted academic practice. No use, distribution or reproduction is permitted which does not comply with these terms.
*Correspondence: Anna Schuhbauer, acschuhbauer@gmail.com